.jpg)
Project Overview
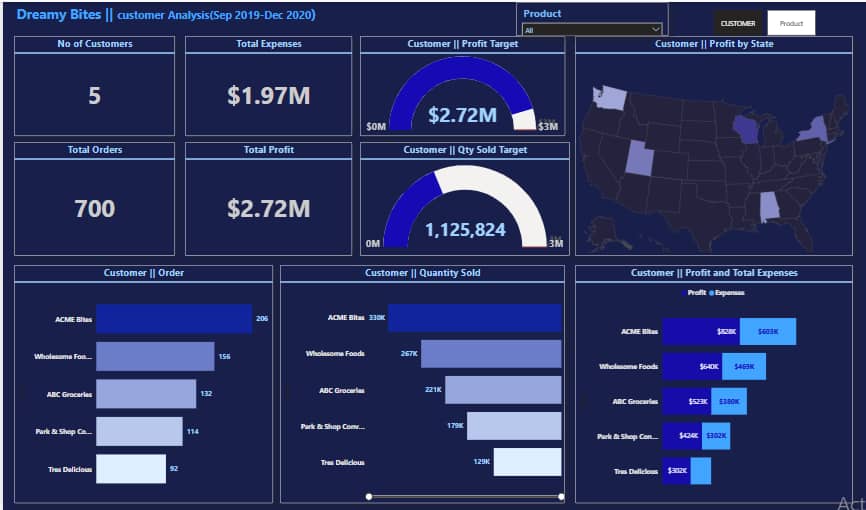
This project examines product performance for Dreamy Bites from September 2019 to December 2020, covering 6 products and 700 orders.
Key Features:
- Breaks down orders and quantity sold by product.
- Analyses profit and quantity sold trends by year and month.
- Tracks total expenses ($1.9M), profit ($2.72M), and a 58% profit margin.
Tools Used:
Powerbi
📥 Download Excel File